Network Monitoring and Analysis Tools
Several tools are available to help with network monitoring, from open source applications to those that require commercial licenses. Two of such tools are Zabbix and Nagios. Nagios sets itself up as the “Industry Standard In IT Infrastructure Monitoring” while Zabbix says it is “the Enterprise-class Monitoring Solution for Everyone”.
1) Zabbix
Zabbix is an Open-Source platform for monitoring network devices as well as servers and workstations in real time.
- Capable of producing customizable maps and logical interconnection diagrams to better visualize network.
- Simple installation and configuration
- An all-in-one solution, which helps monitor and manage network performance across the board.
- Can run with or without an agent
Cons:
- Although scalable, it doesn’t always function particularly well with large infrastructure
- Reporting and monitoring functions could stand to be improved with out-of-the-box support for flat file configuration.
- Can be difficult to properly secure without documentation
- Zabbix agent is not required for monitoring of external network services such as FTP, SSH, HTTP, DNS, LDAP, etc.
2)Nagios
Nagios Core is a free and open source computer-software application that monitors systems, networks and infrastructure. Nagios offers monitoring and alerting services for servers, switches, applications and services. It alerts users when things go wrong and alerts them a second time when the problem has been resolved.
For more info, Click here
3)Cacti
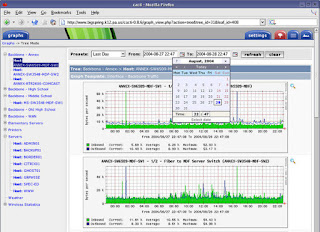
Cacti is a LAMP application that provides a complete graphing framework for data of nearly every sort. In some of my more advanced installations of Cacti, I collect data on everything from fluid return temperatures in data center cooling units to free space on filer volumes to FLEXlm license utilization. If a device or service returns numeric data, it can probably be integrated into Cacti. There are templates to monitor a wide variety of devices, from Linux and Windows servers to Cisco routers and switches -- basically anything that speaks SNMP. There are also collections of contributed templates for an even greater array of hardware and software.
While Cacti's default collection method is SNMP, local Perl or PHP scripts can be used as well. The framework deftly separates data collection and graphing into discrete instances, so it's easy to rework and reorganize existing data into different displays. In addition, you can easily select specific timeframes and sections of graphs simply by clicking and dragging. In some of my installations, I have data going back several years, which proves invaluable when determining if current behavior of a network device or server is truly anomalous or, in fact, occurs regularly.
Cacti is an extensive performance graphing and trending tool that can be used to track nearly any monitored metric that can be plotted on a graph. It's also infinitely customizable, which means it can get complex in places.
For more info, click here
4)OpenNMS
For more info, click here
4)OpenNMS
- OpenNMS is designed for Linux but can support Windows and OSX
as well;
- Easy installation process
- Features ability to configure “Path Outages”;
- Offers Event and Notification Management – receiving both
internal and external events;
- Features thresholding, which is the evaluation of polled
latency data or collected performance data against configurable
thresholds, creating events when these are exceeded or rearmed;
- Alarms and automation – reducing events according to a
reduction key and scripting automated actions centered on alarms;
- Sends notifications regarding noteworthy events via e-mail,
XMPP, or other means.
Pros:
- Free licensing
- Offers good support and documentation through wikis and
mailing lists;
- Full featured and infinitely flexible
- “Path outages” featuring “minimize excessive alerting”
- Reasonable support costs via the OpenNMS Group.
Cons:
- Steep learning curve
- Interface not very intuitive;
- Requires learning and modifying various config files for
customization;
- Money saved on licensing may have to be spent on development
and maintenance.


No comments:
Post a Comment